
Table of Contents
Historical Methodology Audit: The 20 July 2018 EUR/USD Wave Count
This post was first published on 21 July 2018, while its title dated the analysis 20 July 2018. The old version converted one Elliott-wave count directly into two- to three-day long and short instructions. Those levels and labels have expired and are retained only as a historical methodology sample. This is not a current trading signal or investment or personalised financial advice.
Archive Correction: Two Charts, Not Only One Four-Hour Chart
The old text discussed only a four-hour chart, but the archive actually contains separate H1 and H4 EUR/USD charts. Neither image displays the analysis provider, data vendor, or generation time. Dates and times on the horizontal axes are coordinate labels, not timestamps proving when a screenshot was generated or published.
| Archived feature | H1 chart | H4 chart |
|---|---|---|
| Visible interval | EURUSD,H1 | EURUSD,H4 |
| Visible wave labels | Red (c), (d), (e); blue (iv) | Red (i)–(iv) and (a)–(e); blue (iii)–(v) |
| Prominent horizontal levels | About 1.17506, 1.15735, 1.14391 | About 1.17506, 1.15735, 1.14391, 1.13200 |
| Other visible information | MACD(5,34,5), RSI(14), Fibonacci annotations | MACD(5,34,5), RSI(14), Fibonacci annotations |
| Source and generation time | Not shown in the image | Not shown in the image |
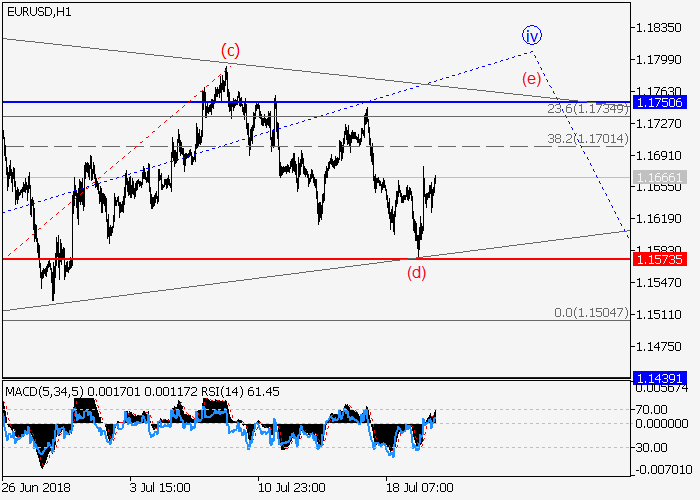
Historical H1 chart: the dashed projection and wave labels record the analytical idea at the time, not the realised subsequent path.
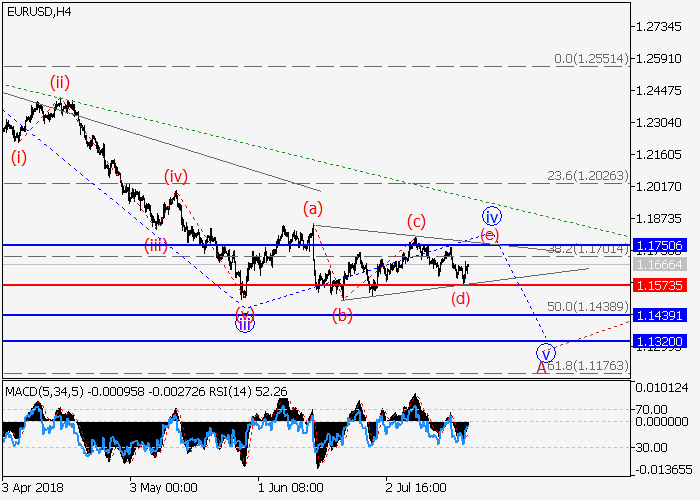
Historical H4 chart: its primary count, triangle, and target regions are not current prices.
What the Original Analysis Hypothesised
The old text described wave A within the higher-degree (2) as developing downward, with a local correction interpreted as the lower-degree wave IV inside A. Its primary count treated IV as a triangle in which (D) had completed and (E) was beginning. It therefore named an upside objective around 1.1750, called 1.1573 both a key and stop-loss level, and stated a two- to three-day validity period.
The alternative associated a move below 1.1573 with a lower region around 1.1440–1.1320. The more precise values drawn in the charts do not exactly match the rounded 1.1750, 1.1573, 1.1440, and 1.1320 in the text. This audit preserves both forms instead of merging them into a new trading rule.
This was an interpretive count: the analyst selected pivots, wave degrees, triangle boundaries, and labels from the price pattern already displayed. The archive did not retain an algorithm for selecting pivots, machine-testable conditions for each label, a register of alternate counts, or a version history of relabelling. Another analyst therefore cannot reproduce the same count strictly from the old text alone.
Interpretive Labels Are Not Testable Rules
A wave chart can organise a market narrative, but a testable forecast must answer, before the outcome: Are pivots identified from closes, highs and lows, bids, or asks? What minimum reversal or number of confirmation bars applies? How are degrees assigned? When is relabelling allowed? If primary and alternate counts coexist, what chooses between them?
The old post did provide 1.1573 and a two- to three-day horizon, which resembles an invalidation level and expiry. Important ambiguity remains:
- Does touching 1.1573 invalidate the count, or is a close on a specified interval required? Is the test based on bid, ask, or midpoint?
- Do the two to three days start at chart analysis, blog publication, or reader receipt? Are they calendar or trading days?
- When the primary count is invalidated, when does the alternate count become active, and may labels be backfilled on the same bar?
- Is the endpoint of a dashed projection a probability scenario, a geometric illustration, or a literal limit-price objective?
- How do spread, commission, markup, financing, slippage, latency, and gaps enter the result?
Answering those questions only after observing the outcome introduces look-ahead, repainting, and retrospective-selection bias.
Official Daily Observations Only Bound the Context
Official ECB and Federal Reserve/FRED daily series provide date-level context. Their sampling times and methods differ, and neither is an executable bid/ask quote from the platform used for the archived charts.
| Date | ECB: US dollars per euro reference rate | Federal Reserve/FRED: US dollars per euro spot rate |
|---|---|---|
| 2018-07-19 | 1.1588 | 1.1604 |
| 2018-07-20 | 1.1670 | 1.1708 |
| 2018-07-23 | 1.1716 | 1.1702 |
The ECB says its reference rates are normally based on a daily concertation procedure at around 14:10 CET and published at around 16:00 CET for information only; transaction use is discouraged. FRED’s DEXUSEU comes from the Federal Reserve’s H.10 release and is described as noon buying rates in New York City for cable transfers payable in foreign currencies. The two daily series have no corresponding working-day observations for the weekend of 21–22 July.
Both official observations on 23 July lie between the old 1.1573 and 1.1750 levels. That does not prove that neither boundary was touched intraday, nor does it establish which event came first. Because the original generation time, blog timezone, horizon definition, quote side, continuous path, and costs are incomplete, three daily points cannot establish that the primary count hit or failed.
Audit Result: Neither the Method Nor Outcome Was Validated
The outcome label for this sample is indeterminate. The source did preserve a primary count, an alternate region, a key level, and a rough horizon—closer to a testable hypothesis than having no invalidation concept at all—but still insufficient to reconstruct an executable test.
Likewise, a later path that visually resembles some wave labels cannot validate wave analysis. If the analyst can move degrees, choose new pivots, or display only a favourable count after the fact, almost any path can be reinterpreted. The object of validation must be the count algorithm, version, and decision rules frozen before the outcome—not a graphical story completed afterwards.
Reproducible Wave-Analysis Protocol
1. Preserve Source, Data, and Version Ancestry
- Record the analysis provider, republisher, data vendor, venue, symbol, timezone, generation time, first-publication time, and retrieval time. Mark missing fields explicitly as unknown.
- Preserve raw OHLC or bid/ask quotes, chart parameters, text, images, and machine-readable labels, with file hashes.
- Every relabelling creates a non-overwriting version identifying its parent, changed pivot or degree, reason for change, and the data cutoff available at the time.
- Disclose payments, referrals, commissions, or other conflicts separately; a branded chart is not a substitute for source provenance.
2. Express Primary and Alternate Counts as Rules
- Before future data are seen, define the pivot algorithm—for example a fixed percentage, volatility threshold, or local extreme with a set number of bars on each side—and whether it uses highs/lows or closes.
- Define permitted degrees, label hierarchy, triangle-recognition criteria, and the precedence rule for label conflicts. Freeze parameters when the evaluation window begins.
- Retain a primary count and every alternate that satisfies the rules. Give each a stable identifier and record supporting and contrary evidence; do not delete failed versions retrospectively.
- If counts receive probabilities, normalise and store them before the outcome. Without a calibration method, report only a ranking rather than invented precision.
3. Predeclare Invalidation, Targets, and Horizon
- For each count, separately define its trigger, price invalidation, time invalidation, target construction, quote side, and evaluation interval.
- State whether a threshold is an intrabar touch, a bar close, or confirmation over several bars, and whether the horizon uses calendar time or trading sessions.
- Fix when or whether an invalidated primary count switches to an alternate and how a bar crossing multiple thresholds is ordered.
- Record “wave count invalidated” separately from the simulated order outcome.
4. Include Executable Data, Costs, and Risk
- Intraday validation requires sufficiently granular, timestamped bid and ask quotes for the full window. A daily reference value or retrospective screenshot cannot reconstruct execution order.
- Stress-test spread, commission, markup, financing, slippage, latency, gaps, partial fills, and rejected orders.
- Before simulation, set maximum tolerable loss per position and for the portfolio, total exposure, and a leverage limit. Do not convert a count without an invalidation level into a position.
- Check recording, signal generation, and execution logic in a demo environment first. A real account adds jurisdiction-specific regulatory, counterparty, and custody risks that require separate review.
5. Conduct Walk-Forward Out-of-Sample Evaluation
- Separate development, parameter selection, and completely unseen evaluation intervals. At each point, let the algorithm use only bars already completed at that time.
- Update counts on a fixed schedule or predefined event; never use a future pivot to repaint an old version. Score every manual intervention as a new version.
- Compare against a simple, preselected baseline and report sample size, coverage, indeterminate rate, primary/alternate switches, before- and after-cost outcomes, maximum drawdown, and worst case.
- Consecutive counts and revisions of one forecast are dependent observations and must not be double-counted as independent wins.
6. Report Hypothetical Results Honestly
- NFA rules and interpretations on hypothetical performance explain that hypothetical results generally benefit from hindsight and cannot fully reflect real financial risk, liquidity, or slippage. Those US requirements apply to the relevant members and promotional materials.
- Keep simulation, backtest, paper signals, and actual fills separate; do not obscure their nature with the word “live.”
- Report all material assumptions, failed counts, costs, and limitations. One directional resemblance, a polished chart, or a high hit rate does not establish future profitability.
- When the evidence was not preserved, the answer is “indeterminate,” not a more convenient wave count drawn later.
How to Read Wave Analysis Today
Do not copy the 2018 labels or levels from this post. For a new wave chart, look first for downloadable data, an objective pivot rule, primary and alternate counts, explicit invalidation, a non-overwriting version history, and an out-of-sample record. A polished path remains an interpretation—not a validated method—if failed versions, costs, and maximum risk are absent.
The CFTC advises retail OTC forex customers to check dealer registration, disciplinary history, and full terms, and highlights risks including dealer control of the platform and displayed prices and leverage magnifying gains and losses. These US materials help identify risk; they do not replace the law where the reader lives or personalised professional advice.
Primary Sources Consulted
- ECB explanation of euro foreign exchange reference rates
- ECB official EUR/USD data, 19–23 July 2018 (CSV)
- Federal Reserve/FRED DEXUSEU series, source, and methodology notes
- Federal Reserve/FRED data, 19–23 July 2018 (CSV)
- CFTC: Eight Things You Should Know Before Trading Forex
- NFA Forex Transactions Regulatory Guide
- NFA Compliance Rule 2-29: Promotional Material and Hypothetical Performance
Verified on 1 September 2026. The chart source and generation time remain independently unconfirmed from the surviving archive. Official historical series can also be revised; any replication should retain the version used and retrieval date.