
Historical audit (September 1, 2026): This archives a EUR/USD forecast that expired in 2018. It is not a current market view, trade instruction, backtest, performance proof, or invitation to open an account. Official daily data later contained observations below both old targets, but the surviving evidence does not show that the forecast succeeded within a pre-specified horizon under executable conditions. Its result is therefore indeterminate.
Table of Contents
Audit conclusion
The old post's central problem is not the absence of one candle that became visible later. It failed to define in advance by when, using which quote, and under what trigger and execution rule. “A number was lower on some later date” is not the same claim as “the forecast met its original test.”
This page preserves the chart and old levels as archival evidence. It does not continue the directional view, produce a current action, or calculate a win rate or return.
What the chart and old text actually preserve
| Field | Visible or recorded content | Evidentiary boundary |
|---|---|---|
| Page date | 2018-08-01 10:18:36 | The page gives no time zone, so it cannot establish the forecast's issue sequence. |
| Chart header | EUR/USD - 1d - 11:47:39 (CET) | A daily interval and clock label are visible, but the chart has no complete date. |
| Chart attribution | “Research © 2018 TRADING CENTRAL” | This is an image label; the surviving files contain no original-report link, permission chain, or data-vendor record. |
| Chart indicator | RSI14 - 9MA | Input price, smoothing, initialization, and rounding rules were not preserved. |
| Reference close | 1.1679 | The post does not identify bid, ask, or mid, or which daily bar closed there. |
| Pivot | 1.1850 *** | The old text was bearish below it and bullish above it, but did not define a break or confirmation rule. |
| Old downside targets | First 1.1500 , then 1.1300 | Both targets are expired and retained only as an archival record. |
| Old upside alternative | First 1.1970 , then 1.2150 * | The record does not say when the alternative activates or how it becomes mutually exclusive. |
| Other old support | 1.1100 * | Asterisks purported to show strength, but no calculation or validation standard survives. |
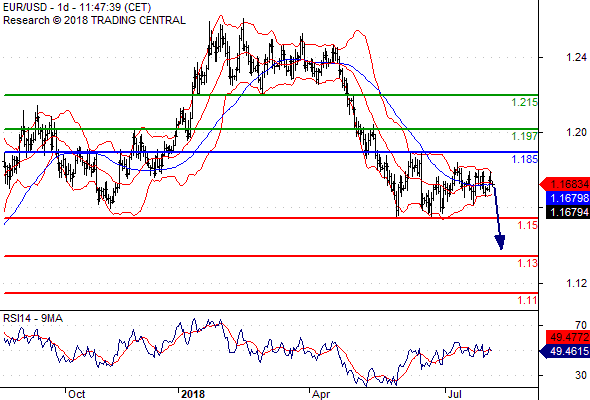
The original image establishes what was left in the record. Its arrow, direction, and levels are not current recommendations.
What kind of range was “1.1300–1.1500”?
The title joins 1.1300 and 1.1500 as a range, while the body says “first 1.1500, then 1.1300,” which looks more like two sequential targets. They are 0.0200 U.S. dollars per euro apart. Under the common EUR/USD convention of 1 pip = 0.0001, that is 200 pips; the old post never defined “point” or pip, however, so this conversion is only a conditional explanation, not a recovered rule.
The absolute differences from the recorded close of 1.1679 to 1.1500 and 1.1300 are 0.0179 and 0.0379—179 and 379 pips under that common convention. A move of that scale means very different things over an intraday, multi-day, or multi-month horizon. The chart's “1d” identifies each bar's interval; it does not define the forecast's lifetime.
How far official historical observations can take us
ECB series EXR.D.USD.EUR.SP00.A contains daily U.S. dollar/euro reference rates. To avoid selecting a convenient result, this audit fixes the download window at August 1 through November 14, 2018. It contains these checkable observations:
| Date | ECB daily reference observation | What it establishes |
|---|---|---|
| 2018-08-01 | 1.1696 | An official observation on the page date; it cannot replace the chart's 1.1679. |
| 2018-08-10 | 1.1456 | The first ECB daily observation below 1.1500 in the fixed window, nine days after the page date. |
| 2018-11-12 | 1.1265 | The first ECB daily observation below 1.1300 in the fixed window, 103 days after the page date. |
Those numbers establish only that the ECB daily reference series recorded those observations on those dates. The ECB expressly says its reference rates are for information, not market transactions. Its current framework also distinguishes transaction data from bid and offer quotes and determines a reference rate around a particular time. A daily reference observation cannot prove when a dealer quote touched a level, which quote side was executable, the targets' order, or a result after costs.
Why the result remains indeterminate
- There is no forecast horizon. Nine days and 103 days describe materially different claims. An auditor cannot select whichever expiry looks best after the event.
- There is no quote side. A reference rate, mid, bid, and ask are not interchangeable fields. The old post does not specify which price triggers entry or exit.
- There is no order rule. “Below 1.1850” might describe the publication state, an intraday touch, a daily close, or an actual fill. There is no stop or cancellation rule.
- There is no path evidence. One daily observation cannot reveal which level was reached first during the day, especially if one bar spans several thresholds.
- There are no costs or position records. Spread, slippage, fees, financing, rejections, position size, and maximum loss are absent. A price observation therefore cannot yield a trading return.
- The source chain is incomplete. The image has an attribution and clock, but no complete chart date, original report, raw data file, revision history, or proof of permission.
It would therefore be misleading to turn “a lower ECB reference observation appeared later” into a performance result for the old forecast. The evidence-supported audit label is indeterminate, not hit or miss.
Reusable risk-first audit protocol
1. Build an evidence ledger
- Preserve the original text, chart, URL, file hash, and first-capture time without overwriting the source version.
- Record the publisher, full date, ISO 8601 time zone, revision history, and potential conflicts of interest.
- Keep visible facts separate from external inferences; write “unknown” when a field cannot be found.
2. Turn the forecast into a testable contract
- Define the product, direction, baseline, pivot, targets, invalidation, and one start and end time.
- Define a “point” or pip and whether the event is a touch, closing confirmation, or actual fill.
- Predefine ordering when one bar crosses several levels; do not replace the rule after seeing the path.
3. Lock the appropriate data
- Record the venue or dealer, vendor, pair direction, bid/ask/mid, frequency, bar time zone, and revision policy.
- Official reference data can cross-check broad market context, but cannot replace execution data unless the original rule specified it.
- Save the query, series key, download window, and raw file so another auditor can reproduce the observations.
4. Handle costs and worst cases first
- Record chart price, executable quote, and actual fill separately, including spread, slippage, fees, and financing.
- Before any real-world decision, separately assess maximum loss, leverage, margin-call, liquidity, and counterparty risk.
- Without a verifiable order and position, report no profit or loss. A level touch is not proof of return.
5. Report with pre-limited labels
- Classify only under the frozen rule: hit, miss, not triggered, or indeterminate.
- Report every sample, missing field, rule deviation, and data revision, not only favorable cases.
- Keep a historical audit separate from a new market view. This page contains no new market view.
Risk and use boundary
The U.S. CFTC warns that, in the U.S. retail OTC forex setting, a customer may face a dealer rather than an open exchange, the dealer controls displayed platform prices, and margin and leverage amplify gains and losses. This is a general risk warning, not an allegation about the institution named in the chart, and it does not replace the rules of other jurisdictions.
This article explains source and audit methods. It is not investment, legal, or tax advice and contains no current price, entry, stop, position, or leverage suggestion. When the record is incomplete, the safe and truthful answer is “indeterminate.”
Primary sources and remaining uncertainty
- ECB Data Portal: Daily U.S. dollar/euro reference-rate series
- ECB Data API: Fixed CSV query for August 1–November 14, 2018
- ECB: Framework for the euro foreign exchange reference rates (June 23, 2026)
- U.S. Commodity Futures Trading Commission: Eight Things You Should Know Before Trading Forex
Sources were checked on September 1, 2026. The old chart's complete date, the provider's convention for “CET,” original report and data source, forecast horizon, quote side, orders, costs, and permission chain remain unconfirmed. The CFTC material applies to the U.S. retail OTC forex environment it describes; rules vary by jurisdiction and product.