
Table of Contents
Historical Audit: The 09:22 CET EUR/USD Forecast of 1 August 2018
This post was first published on 1 August 2018 as a short-term EUR/USD price-level forecast. The old forecast is retained here only to audit the historical evidence, not to reactivate a signal. Its levels do not apply today, and this is not trading, investment, or personalised financial advice. This 1 September 2026 revision removes direct long, short, and target-price instructions and refuses to present later market movement as proof of profit or a win rate.
Archive Snapshot: What the Old Post Actually Recorded
The table transcribes what can be read directly from the old text and image. Every price is an archival field from 2018, not a current level at which to place an order.
| Item | Archived record |
|---|---|
| Currency pair and interval | EUR/USD, 30-minute chart |
| Time shown in the chart | 2018-08-01 09:22:50 CET |
| Attribution in the chart | Trading Central Research, © 2018 |
| Value called the “closing price” in the text | 1.1689 |
| Dividing level | 1.1705 |
| Old targets below that level | 1.1665, then 1.1645; 1.1635 also listed as support |
| Old targets above that level | 1.1730, then 1.1745 |
| Technical description | RSI mixed with a downside bias; the text mentioned strength stars, but no actual star ratings were preserved |
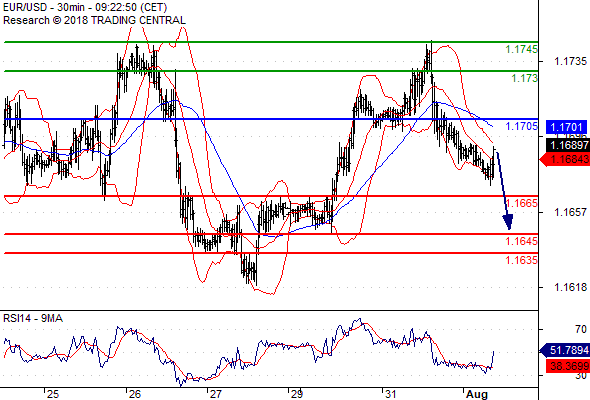
Historical image: the arrow, curves, and levels record the forecast at the time; they are not a current signal.
The image’s right edge shows more than one value near 1.1689, but the archive has no legend identifying them as bid, ask, an indicator value, or another field. This audit therefore preserves the text’s “1.1689” label without inventing a quote side.
The “24–44 points” in the original title appears to correspond to the differences of 0.0024 and 0.0044 from 1.1689 to 1.1665/1.1645. The Chinese source did not define “point.” The old English translation silently called them “pips,” which the evidence does not justify; the wording is now kept neutral and historical.
Why the Evidence Gaps Affect the Result
The time shown inside a chart is not the same as the time an article became available to the public. The WordPress archive records 2018-08-01T07:54:48 without a timezone, and the surviving files include no server publication log, provider version identifier, or timestamped reader receipt. The sequence of chart generation, article publication, and reader access therefore cannot be established reliably.
The archive also lacks:
- the original quote provider and whether each price was bid, ask, or midpoint;
- the scenario trigger, expiry, order type, stop, or other invalidation condition;
- minute- or tick-level bid and ask quotes covering the entire validity window, including bad-tick rules;
- the contemporaneous spread, commission, markup, financing, slippage, latency, gaps, and rejected orders;
- every consecutive forecast, revision, and unsuccessful case from the same provider;
- an immutable record proving that the image was not replaced or overwritten after the outcome.
Without those materials, an audit cannot select a favourable window from a later chart or convert “directionally similar” into an executable net result.
Official Daily Observations Provide Context Only
Official ECB and Federal Reserve/FRED daily series can establish date-level context. Their sampling methods and times differ, and neither is the continuous bid/ask feed behind this chart.
| Date | ECB: US dollars per euro reference rate | Federal Reserve/FRED: US dollars per euro spot rate |
|---|---|---|
| 2018-07-31 | 1.1736 | 1.1706 |
| 2018-08-01 | 1.1696 | 1.1666 |
| 2018-08-02 | 1.1617 | 1.1612 |
The ECB says its reference rates are normally based on a daily concertation procedure at around 14:10 CET and published at around 16:00 CET for information only; using them for transactions is discouraged. FRED’s DEXUSEU comes from the Federal Reserve’s H.10 release and is described as noon buying rates in New York City for cable transfers payable in foreign currencies. Different official observations are expected when their definitions and sampling times differ.
The ECB observation of 1.1696 on 1 August is above the archived 1.1689, while FRED’s 1.1666 is close to the old first target of 1.1665; both observations for 2 August are below the old second target of 1.1645. These points show that later daily observations were lower, but they cannot reconstruct the intraday path, event order, or executable net outcome.
Audit Result: Indeterminate
The old post did not preserve its horizon, invalidation rules, quote side, or continuous data. A lower daily observation on 2 August therefore does not prove that a target was reached within the permitted window, on the correct quote side, and after costs. Nor is there enough evidence to call it a failure.
The audit label for this sample is indeterminate. That is a separation of evidentiary sufficiency from market direction: observing lower daily values later is not the same as verifying a trade, and it certainly does not establish that a method is profitable.
Reusable Versioned Forecast-Validation Protocol
1. Create a Non-Overwriting Snapshot for Every Version
- Record provider-generation time, first-publication time, receipt time, and each timezone. Preserve the original fields even when normalising them to UTC.
- Save the source text, image, structured parameters, and data documentation with a file hash, retrieval date, and parent version. A revision should add a version, never overwrite the earlier one.
- Record the content provider, republisher, and data vendor separately, along with any payment, referral, commission, or other conflict.
- If no trustworthy pre-outcome timestamp exists, mark “available in advance” as unverified.
2. Fix the Decision Rules Before the Outcome
- State the quotation direction, market or venue, quote provider, bid/ask/midpoint convention, and chart interval.
- Define the trigger, targets, stop or other invalidation condition, maximum horizon, and order type.
- Define the unit meant by “point,” “pip,” or percentage, how multiple targets count, and how the order of trigger, target, and invalidation is evaluated.
- At minimum, use the labels: not triggered, target first, invalidation first, expired unresolved, and insufficient data.
3. Use Data Capable of Answering the Question
- An intraday target test requires sufficiently granular, timestamped bid and ask quotes covering the full validity window. A daily reference value, close, or retrospective screenshot cannot prove the intraday execution path.
- Preserve the raw data version and documentation, including timezone, daylight-saving treatment, missing values, revisions, bad ticks, and vendor or symbol changes.
- Use only information available after the forecast’s publication. Do not select the most favourable dealer, observation time, quote side, or interpolation method after seeing the outcome.
- When evidence is inadequate, retain “indeterminate” rather than filling the gap with assumptions.
4. Quantify Risk and Execution Friction First
- In simulated research, first set the maximum tolerable loss for one position and the portfolio. Without a defined invalidation point, risk exposure cannot be estimated reliably.
- Stress-test the spread, commission, markup, financing, slippage, latency, gaps, partial fills, and rejected orders rather than observing only midpoint changes.
- Leverage magnifies both gains and losses. The CFTC warns that retail OTC forex generally puts the dealer directly opposite the customer, while the dealer also controls the platform and displayed prices.
- Validate the recording and execution process in a demo environment first. Before considering a real account, check authorization, disciplinary history, funding protections, and full terms under the rules where you live; CFTC/NFA checks cover only their US jurisdiction.
5. Score a Consecutive Sample, Not a Story
- Preregister the evaluation window and preserve every consecutive version, failure, untriggered case, and indeterminate result.
- Updates to one forecast are not independent samples. Decide in advance whether scoring uses the first version, the latest version before a cutoff, or treats revisions as a separate research question; do not double-count them.
- Report sample size, version coverage, gross and after-cost results, maximum drawdown, the worst case, and every rule change. Hit rate by itself does not demonstrate profitability.
- Separate parameter selection from out-of-sample validation, and never turn one directional resemblance, simulation, or favourable screenshot into a promise of future performance.
How to Read Similar Material Today
Do not copy the 2018 levels from this post. For new forex analysis, first inspect the verifiable timestamp, version history, expiry, invalidation, quote side, full costs, and maximum loss. A detailed chart cannot cure missing evidence when material urges immediate funding, claims high returns, displays only successful versions, or funnels readers into private messages and referral sign-up links.
US NFA rules require the relevant retail forex members to disclose commissions, other fees, markups or markdowns, or midpoint-spread costs. The CFTC also recommends checking dealer registration and disciplinary history and warns about hidden marketing relationships and excessive leverage. These sources help identify risk; they do not replace the law where the reader lives or personalised professional advice.
Primary Sources Consulted
- ECB explanation of euro foreign exchange reference rates
- ECB official EUR/USD data, 31 July–2 August 2018 (CSV)
- Federal Reserve/FRED DEXUSEU series, source, and methodology notes
- Federal Reserve/FRED data, 31 July–2 August 2018 (CSV)
- CFTC: Eight Things You Should Know Before Trading Forex
- NFA Forex Transactions Regulatory Guide
Verified on 1 September 2026. Official historical series can be revised; any replication should retain the version used and its retrieval date.